RocketMQ Prometheus Exporter
简介
Rocketmq-exporter 是一个用于监控 RocketMQ broker 和 client 侧所有相关指标的系统,它将通过 mqAdmin 从 broker 侧获取到的指标值封装到 87 个缓存中。
在之前的版本中,有 87 个 concurrentHashMaps,但由于 Map 不会删除过期的指标,一旦标签发生变化,就会生成新的指标,而旧的、未使用的指标无法自动删除,最终导致内存溢出。但是,使用 Cache 结构可以实现过期删除,并且可以配置过期时间。
`Rocketmq-exporter` 获取监控指标的流程如下图所示。Exporter 通过 MQAdminExt 从 MQ 集群请求数据,请求到的数据通过 MetricService 标准化为 Prometheus 所需的格式,然后通过 `/metrics` 接口暴露给 Prometheus。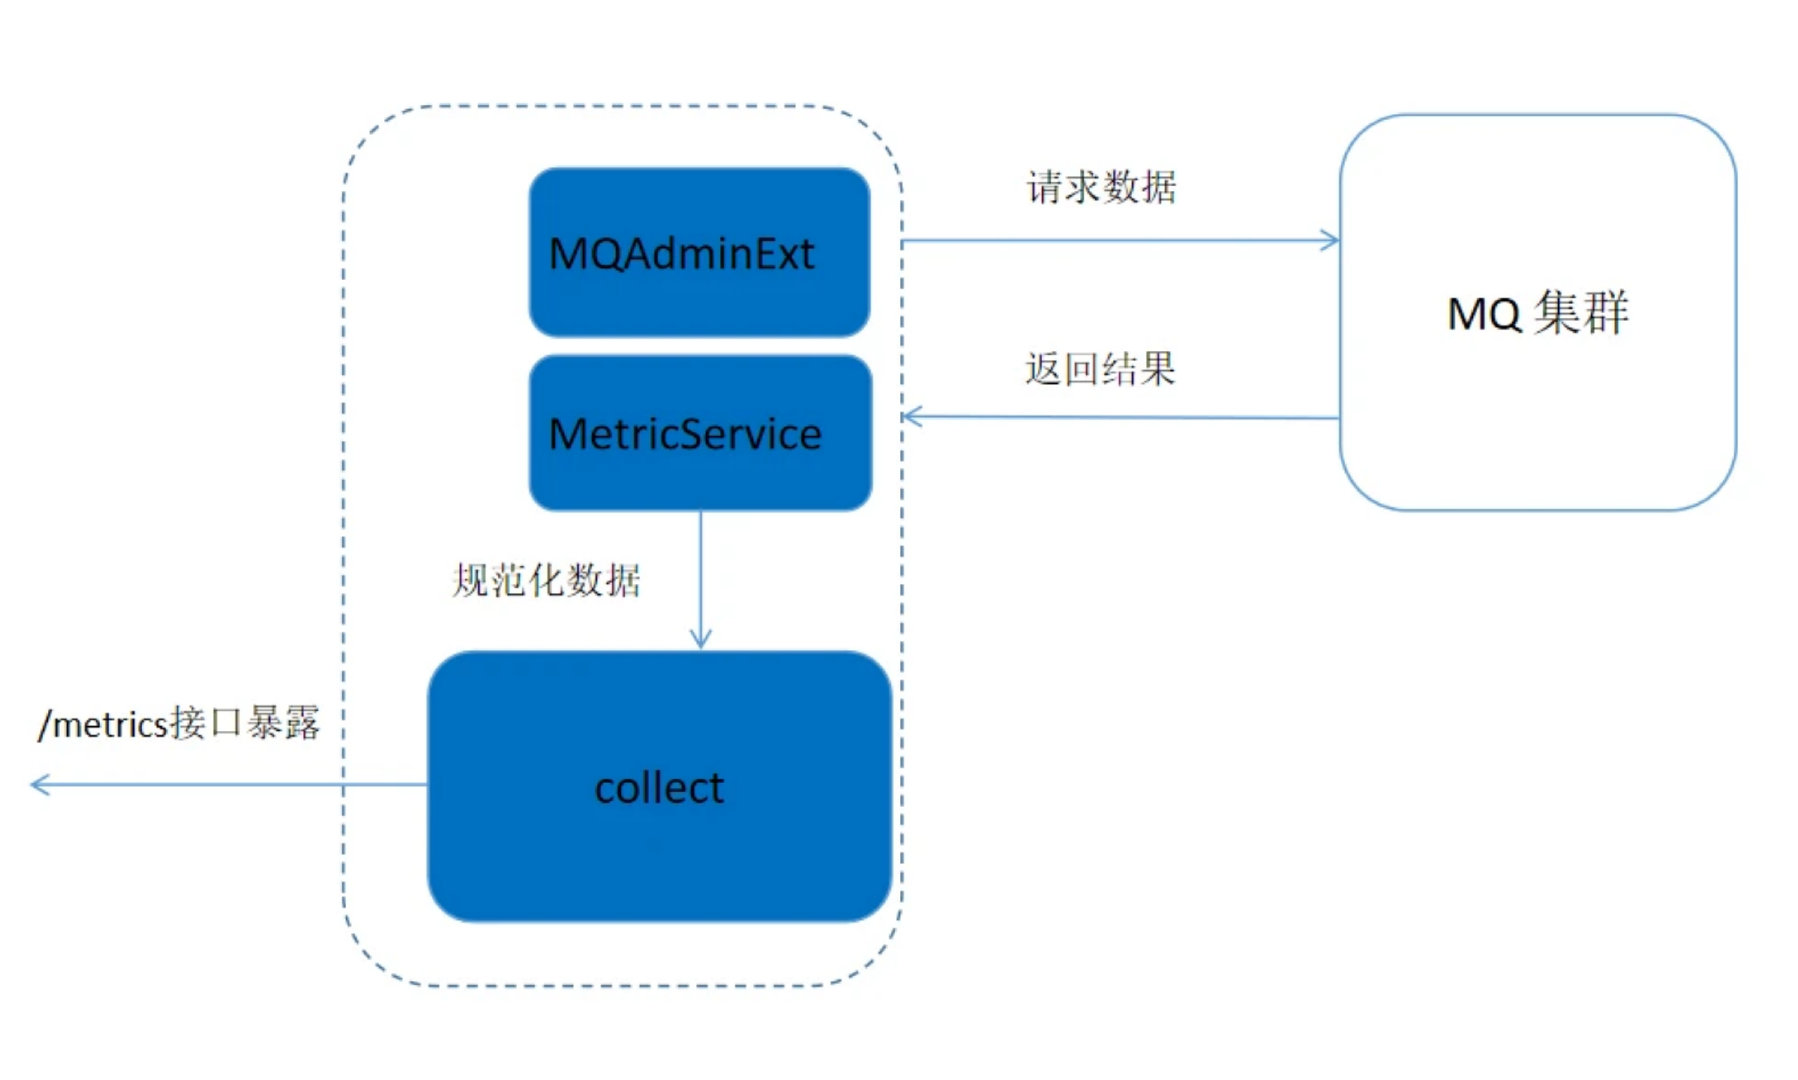
指标结构
Metric 类位于 **`org.apache.rocketmq.expoter.model.metrics`** 包中,本质上是一组实体类,每个实体类代表一种指标类型,总共有 14 个 Metric 类。这些类是 87 个缓存的键,并通过不同的标签值进行区分。
- Broker 相关指标类 : BrokerRuntimeMetric、BrokerMetric、DLQTopicOffsetMetric、TopicPutNumMetric
- 消费者相关类 : ConsumerRuntimeConsumeFailedMsgsMetric 、ConsumerRuntimeConsumeFailedTPSMetric 、ConsumerRuntimeConsumeOKTPSMetric、ConsumerRuntimeConsumeRTMetric、ConsumerRuntimePullRTMetric、ConsumerRuntimePullTPSMetric、ConsumerCountMetric、ConsumerMetric、ConsumerTopicDiffMetric
- 生产者相关指标类: ProducerMetric
Prometheus 拉取指标
RocketMQ-exporter 项目和 `Prometheus` 相当于服务器-客户端关系,其中 `RocketMQ-exporter` 项目引入了 Prometheus 客户端包,该包在项目的 MetricFamilySamples 类中指定要获取的信息类型。Prometheus 从 exporter 请求指标,exporter 将信息打包成相应的类型后返回给 Prometheus。
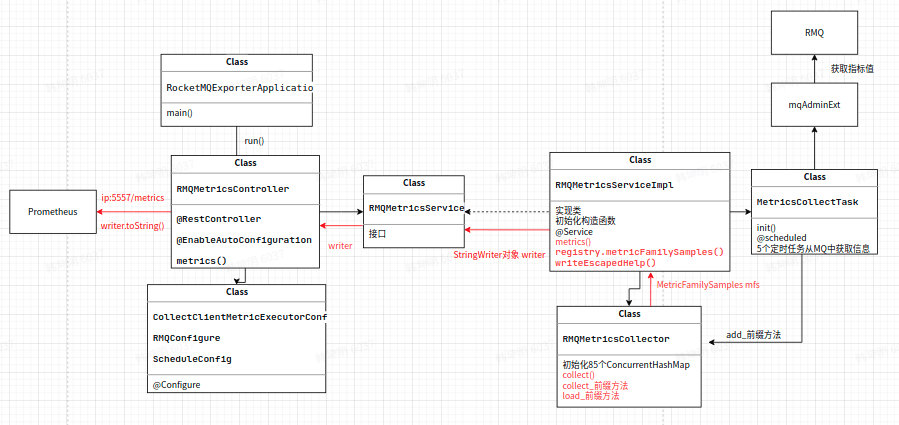
rocketmq-exporter 项目启动后,会将 RocketMQ 的各种指标收集到 mfs 对象中。当浏览器或 Prometheus 访问相应的接口时,mfs 对象中的样本将通过服务生成 Prometheus 支持的格式化数据。主要包括以下步骤:
浏览器访问 ip:5557/metrics 以调用 RMQMetricsController 类中的 metrics 方法,其中 ip 是运行 rocketmq-exporter 项目的主机 IP。
private void metrics(HttpServletResponse response) throws IOException {
    StringWriter writer = new StringWriter();
    metricsService.metrics(writer);
    response.setHeader("Content-Type", "text/plain; version=0.0.4; charset=utf-8");
    response.getOutputStream().print(writer.toString());
}
通过创建一个新的 StringWriter 对象来收集指标,exporter 中的指标通过 MetricsService 类中的 metrics 方法收集到 writer 对象中,然后将收集到的指标输出到网页。
收集到的指标格式为:
<metric name>{<label name>=<label value>, ...} <metric value>
示例:
rocketmq_group_diff{group="rmq_group_test_20220114",topic="fusion_console_tst",countOfOnlineConsumers="0",msgModel="1",} 23.0
MetricCollectTask 类中的 5 个定时任务
MetricCollectTask 类有五个定时任务:collectTopicOffset、collectConsumerOffset、collectBrokerStatsTopic、collectBrokerStats 和 collectBrokerRuntimeStats。它们用于收集消费者偏移量信息和 Broker 状态信息等。其 cron 表达式为:`cron: 15 0/1 * * * ?`,这意味着它将每分钟收集一次。其核心功能是通过 mqAdminExt 对象从集群中的 broker 获取信息,然后将其添加到相应的 87 个监控指标中,以 collectTopicOffset 为例
首先,初始化 TopicList 对象,并通过 mqAdminExt.fetchAllTopicList() 方法获取集群中的所有 topic 信息。
TopicList topicList = null;
try {
    topicList = mqAdminExt.fetchAllTopicList();
} catch (Exception ex) {
        log.error(String.format("collectTopicOffset-exception comes getting topic list from namesrv, address is %s",
            JSON.toJSONString(mqAdminExt.getNameServerAddressList())));
        return;
}
将 topic 添加到 topicSet 中,并遍历每个 topic,通过 mqAdminExt.examineTopicStats(topic) 函数检查 topic 状态。
Set < String > topicSet = topicList != null ? topicList.getTopicList() : null;
for (String topic: topicSet) {
     TopicStatsTable topicStats = null;
     try {
         topicStats = mqAdminExt.examineTopicStats(topic);
     } catch (Exception ex) {
         log.error(String.format("collectTopicOffset-getting topic(%s) stats error. the namesrv address is %s",
             topic,
             JSON.toJSONString(mqAdminExt.getNameServerAddressList())));
         continue;}
初始化 topic 状态集、按 broker 划分 topic 信息偏移量的哈希表 brokerOffsetMap,以及以 broker 名称为键存储更新时间戳的哈希表 brokerUpdateTimestampMap。
Set<Map.Entry<MessageQueue, TopicOffset>> topicStatusEntries = topicStats.getOffsetTable().entrySet();
HashMap<String, Long> brokerOffsetMap = new HashMap<>();
HashMap<String, Long> brokerUpdateTimestampMap = new HashMap<>();
for (Map.Entry<MessageQueue, TopicOffset> topicStatusEntry : topicStatusEntries) {
    MessageQueue q = topicStatusEntry.getKey();
    TopicOffset offset = topicStatusEntry.getValue();
    if (brokerOffsetMap.containsKey(q.getBrokerName())) {
        brokerOffsetMap.put(q.getBrokerName(), brokerOffsetMap.get(q.getBrokerName()) + offset.getMaxOffset());
    } else {
        brokerOffsetMap.put(q.getBrokerName(), offset.getMaxOffset());
    }
    if (brokerUpdateTimestampMap.containsKey(q.getBrokerName())) {
        if (offset.getLastUpdateTimestamp() > brokerUpdateTimestampMap.get(q.getBrokerName())) {
            brokerUpdateTimestampMap.put(q.getBrokerName(), offset.getLastUpdateTimestamp());
        }
    } else {
        brokerUpdateTimestampMap.put(q.getBrokerName(),
        offset.getLastUpdateTimestamp());
    }
}
最后,通过遍历 brokerOffsetMap 中的每个项,通过 metricsService 获取 metricCollector 对象,并调用 RMQMetricsCollector 类中的 addTopicOffsetMetric 方法,将相应的值添加到 RMQMetricsCollector 类中 87 个指标的其中一个缓存中。
 Set<Map.Entry<String, Long>> brokerOffsetEntries = brokerOffsetMap.entrySet();
        for (Map.Entry<String, Long> brokerOffsetEntry : brokerOffsetEntries) {
            metricsService.getCollector().addTopicOffsetMetric(clusterName, brokerOffsetEntry.getKey(), topic,
                brokerUpdateTimestampMap.get(brokerOffsetEntry.getKey()), brokerOffsetEntry.getValue());
        }
    }
    log.info("topic offset collection task finished...." + (System.currentTimeMillis() - start));
}
Rocketmq-exporter 指标收集流程图
快速入门
配置 `application.yml`
`application.yml` 中的重要配置包括:
server.port 设置 Prometheus 监听 rocketmq-exporter 的端口,默认值为 5557。
rocketmq.config.webTelemetryPath 配置 Prometheus 获取指标的路径,默认值为 `/metrics`。可以使用默认值。
rocketmq.config.enableACL 如果 RocketMQ 集群启用了 ACL 验证,则需要将其设置为 true,并在 accessKey 和 secretKey 中配置相应的 ak 和 sk。
rocketmq.config.outOfTimeSeconds 用于配置存储指标及其值的过期时间。如果超过此时间且缓存中的键未发生写入更改,则将被删除。通常可以配置为 60s(Prometheus 获取指标的时间间隔应根据过期时间合理配置,只要过期时间大于等于 Prometheus 收集指标的时间间隔即可)。
task.*.cron 配置 exporter 通过定时任务从 broker 拉取指标的时间间隔,默认值为 `15 0/1 * * * ?`,表示每分钟的第 15 秒拉取一次指标。
启动 exporter 应用
根据 Prometheus 官网配置启动 Prometheus
将 Prometheus 的 `static_config: -targets` 配置为 exporter 的启动 IP 和端口,例如:`localhost:5557`。
访问 Prometheus 页面
如果 localhost 以默认的 `localhost:9090` 启动,您可以查看收集到的指标值,如下图所示
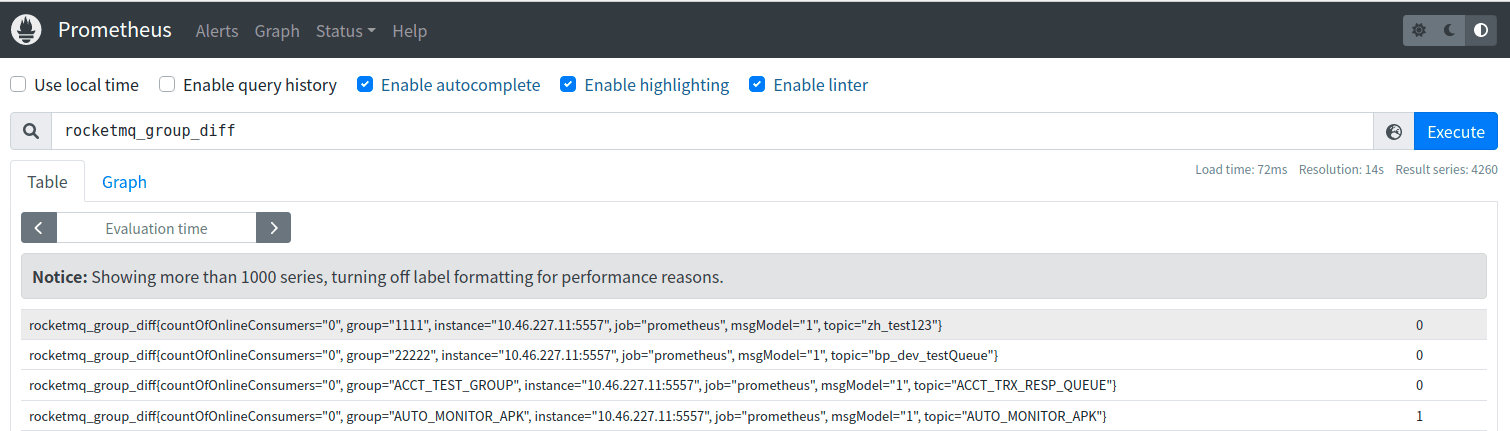
为了更好的可视化效果和观察指标值变化趋势,Prometheus 最好与 Grafana 配合使用!
可观测性指标
可观测性指标主要包括两类:服务端指标和客户端指标。服务端指标由服务器直接生成,客户端指标在客户端生成并通过 RPC 请求由服务器获取。客户端指标可进一步分为生产者指标和消费者指标。所有 87 个可观测性指标及其主要含义如下:
服务端指标
服务端指标
| 指标名称 | 定义 | 对应 Broker 指标名称 |
|---|---|---|
| rocketmq_broker_tps | Broker 级生产 TPS | |
| rocketmq_broker_qps | Broker 级消费 QPS | |
| rocketmq_broker_commitlog_diff | Broker 组从从节点同步落后消息大小 | |
| rocketmq_brokeruntime_pmdt_0ms | 服务端写入请求到完成写入的处理时间(0ms) | putMessageDistributeTime |
| rocketmq_brokeruntime_pmdt_0to10ms | 服务端写入请求到完成写入的处理时间(0~10ms) | |
| rocketmq_brokeruntime_pmdt_10to50ms | 服务端写入请求到完成写入的处理时间(10~50ms) | |
| rocketmq_brokeruntime_pmdt_50to100ms | 服务端写入请求到完成写入的处理时间(50~100ms) | |
| rocketmq_brokeruntime_pmdt_100to200ms | 服务端写入请求到完成写入的处理时间(100~200ms) | |
| rocketmq_brokeruntime_pmdt_200to500ms | 服务端写入请求到完成写入的处理时间(200~500ms) | |
| rocketmq_brokeruntime_pmdt_500to1s | 服务端写入请求到完成写入的处理时间(500~1000ms) | |
| rocketmq_brokeruntime_pmdt_1to2s | 服务端写入请求到完成写入的处理时间(1~2s) | |
| rocketmq_brokeruntime_pmdt_2to3s | 服务端写入请求到完成写入的处理时间(2~3s) | |
| rocketmq_brokeruntime_pmdt_3to4s | 服务端写入请求到完成写入的处理时间(3~4s) | |
| rocketmq_brokeruntime_pmdt_4to5s | 服务端写入请求到完成写入的处理时间(4~5s) | |
| rocketmq_brokeruntime_pmdt_5to10s | 服务端写入请求到完成写入的处理时间(5~10s) | |
| rocketmq_brokeruntime_pmdt_10stomore | 服务端写入请求到完成写入的处理时间(> 10s) | |
| rocketmq_brokeruntime_dispatch_behind_bytes | 尚未分发的消息字节数(例如构建索引等操作) | dispatchBehindBytes |
| rocketmq_brokeruntime_put_message_size_total | 写入 broker 的消息总大小 | putMessageSizeTotal |
| rocketmq_brokeruntime_put_message_average_size | 写入 broker 的消息平均大小 | putMessageAverageSize |
| rocketmq_brokeruntime_remain_transientstore_buffer_numbs | TransientStorePool 中队列的容量 | remainTransientStoreBufferNumbs |
| rocketmq_brokeruntime_earliest_message_timestamp | broker 存储的最早消息时间戳 | earliestMessageTimeStamp |
| rocketmq_brokeruntime_putmessage_entire_time_max | 自 broker 运行以来,写入消息的最大耗时 | putMessageEntireTimeMax |
| rocketmq_brokeruntime_start_accept_sendrequest_time | broker 开始接受发送请求的时间 | startAcceptSendRequestTimeStamp |
| rocketmq_brokeruntime_putmessage_times_total | 写入 broker 的消息总次数 | putMessageTimesTotal |
| rocketmq_brokeruntime_getmessage_entire_time_max | 自 broker 运行以来,处理消息拉取请求的最大耗时 | getMessageEntireTimeMax |
| rocketmq_brokeruntime_pagecache_lock_time_mills | pageCacheLockTimeMills | |
| rocketmq_brokeruntime_commitlog_disk_ratio | commitLog 所在磁盘的使用率 | commitLogDiskRatio |
| rocketmq_brokeruntime_dispatch_maxbuffer | broker 未计算且保持为 0 的值 | dispatchMaxBuffer |
| rocketmq_brokeruntime_pull_threadpoolqueue_capacity | 处理拉取请求的线程池队列容量。 | pullThreadPoolQueueCapacity |
| rocketmq_brokeruntime_send_threadpoolqueue_capacity | 处理发送请求的线程池队列容量 | sendThreadPoolQueueCapacity |
| rocketmq_brokeruntime_query_threadpool_queue_capacity | 处理查询请求的线程池队列容量 | queryThreadPoolQueueCapacity |
| rocketmq_brokeruntime_pull_threadpoolqueue_size | 处理拉取请求的线程池队列实际大小 | pullThreadPoolQueueSize |
| rocketmq_brokeruntime_query_threadpoolqueue_size | 处理查询请求的线程池队列实际大小 | queryThreadPoolQueueSize |
| rocketmq_brokeruntime_send_threadpool_queue_size | 处理发送请求的线程池队列实际大小 | sendThreadPoolQueueSize |
| rocketmq_brokeruntime_pull_threadpoolqueue_headwait_timemills | 处理拉取请求的线程池队列中头部任务的等待时间 | pullThreadPoolQueueHeadWaitTimeMills |
| rocketmq_brokeruntime_query_threadpoolqueue_headwait_timemills | 处理查询请求的线程池队列中头部任务的等待时间 | queryThreadPoolQueueHeadWaitTimeMills |
| rocketmq_brokeruntime_send_threadpoolqueue_headwait_timemills | 处理发送请求的线程池队列中头部任务的等待时间 | sendThreadPoolQueueHeadWaitTimeMills |
| rocketmq_brokeruntime_msg_gettotal_yesterdaymorning | 截至昨晚午夜,消息读取的总次数 | msgGetTotalYesterdayMorning |
| rocketmq_brokeruntime_msg_puttotal_yesterdaymorning | 截至昨晚午夜,消息写入的总次数 | msgPutTotalYesterdayMorning |
| rocketmq_brokeruntime_msg_gettotal_todaymorning | 截至今晚午夜,消息读取的总次数 | msgGetTotalTodayMorning |
| rocketmq_brokeruntime_msg_puttotal_todaymorning | 截至今晚午夜,消息写入的总次数 | putMessageTimesTotal |
| rocketmq_brokeruntime_msg_put_total_today_now | 目前写入每个 broker 的消息数量。 | msgPutTotalTodayNow |
| rocketmq_brokeruntime_msg_gettotal_today_now | 目前从每个 broker 读取的消息数量。 | msgGetTotalTodayNow |
| rocketmq_brokeruntime_commitlogdir_capacity_free | commitLog 存储目录中的可用空间。 | commitLogDirCapacity |
| rocketmq_brokeruntime_commitlogdir_capacity_total | commit logs 存储目录中的总空间。 | |
| rocketmq_brokeruntime_commitlog_maxoffset | commitLog 的最大偏移量。 | commitLogMaxOffset |
| rocketmq_brokeruntime_commitlog_minoffset | commitLog 的最小偏移量。 | commitLogMinOffset |
| rocketmq_brokeruntime_remain_howmanydata_toflush | remainHowManyDataToFlush | |
| rocketmq_brokeruntime_getfound_tps600 | 过去 600 秒内 getMessage 期间接收到的消息的平均 TPS。 | getFoundTps |
| rocketmq_brokeruntime_getfound_tps60 | 过去 60 秒内 getMessage 期间接收到的消息的平均 TPS。 | |
| rocketmq_brokeruntime_getfound_tps10 | 过去 10 秒内 getMessage 期间接收到的消息的平均 TPS。 | |
| rocketmq_brokeruntime_gettotal_tps600 | 过去 600 秒内 getMessage 调用平均 TPS。 | getTotalTps |
| rocketmq_brokeruntime_gettotal_tps60 | 过去 60 秒内 getMessage 调用平均 TPS。 | |
| rocketmq_brokeruntime_gettotal_tps10 | 过去 10 秒内 getMessage 调用平均 TPS。 | |
| rocketmq_brokeruntime_gettransfered_tps600 | getTransferedTps | |
| rocketmq_brokeruntime_gettransfered_tps60 | ||
| rocketmq_brokeruntime_gettransfered_tps10 | ||
| rocketmq_brokeruntime_getmiss_tps600 | 过去 600 秒内 getMessage 未获取到消息的平均 TPS | getMissTps |
| rocketmq_brokeruntime_getmiss_tps60 | 过去 60 秒内 getMessage 未获取到消息的平均 TPS | |
| rocketmq_brokeruntime_getmiss_tps10 | 过去 10 秒内 getMessage 未获取到消息的平均 TPS | |
| rocketmq_brokeruntime_put_tps600 | 过去 600 秒内消息写入操作的平均 TPS | putTps |
| rocketmq_brokeruntime_put_tps60 | 过去 60 秒内消息写入操作的平均 TPS | |
| rocketmq_brokeruntime_put_tps10 | 过去 10 秒内消息写入操作的平均 TPS |
生产者指标
生产者指标
| 指标名称 | 定义 |
|---|---|
| rocketmq_producer_offset | 当前 Topic 的最大偏移量 |
| rocketmq_topic_retry_offset | 当前重试 Topic 的最大偏移量 |
| rocketmq_topic_dlq_offset | 当前死信 Topic 的最大偏移量 |
| rocketmq_producer_tps | Topic 在 Broker 组上的生产 TPS |
| rocketmq_producer_message_size | Topic 在 Broker 组上的生产消息大小 TPS |
| rocketmq_queue_producer_tps | 队列级生产 TPS |
| rocketmq_queue_producer_message_size | 队列级生产消息大小 TPS |
消费者指标
消费者指标
| 指标名称 | 定义 |
|---|---|
| rocketmq_group_diff | 消费组消息堆积数量 |
| rocketmq_group_retrydiff | 消费组重试队列堆积数量 |
| rocketmq_group_dlqdiff | 消费组死信队列堆积数量 |
| rocketmq_group_count | 消费组内的消费者数量 |
| rocketmq_client_consume_fail_msg_count | 消费组内消费者过去 1 小时消费失败次数 |
| rocketmq_client_consume_fail_msg_tps | 消费组消费失败 TPS |
| rocketmq_client_consume_ok_msg_tps | 消费组消费成功 TPS |
| rocketmq_client_consume_rt | 消息拉取后被消费的耗时 |
| rocketmq_client_consumer_pull_rt | 客户端拉取消息的耗时 |
| rocketmq_client_consumer_pull_tps | 客户端拉取消息 TPS |
| rocketmq_consumer_tps | 订阅组在各 Broker 组上的消费 TPS |
| rocketmq_group_consume_tps | 订阅组当前消费 TPS(由 Broker 聚合 rocketmq_consumer_tps) |
| rocketmq_consumer_offset | 订阅组在 Broker 组中的当前消费偏移量 |
| rocketmq_group_consume_total_offset | 订阅组当前消费偏移量(由 Broker 聚合 rocketmq_consumer_offset) |
| rocketmq_consumer_message_size | 订阅组在 Broker 组中消费消息大小的 TPS |
| rocketmq_send_back_nums | 订阅组在 Broker 组中消费失败并写入重试消息的次数 |
| rocketmq_group_get_latency_by_storetime | 消费组的消费延迟,即当前时间与 exporter 获取消息时的时间差。 |